BioTuring Browser
Project information
- Category: Desktop software
- Location: BioTuring | Vietnam
- URL: https://bioturing.com/
03/2020 - 07/2022
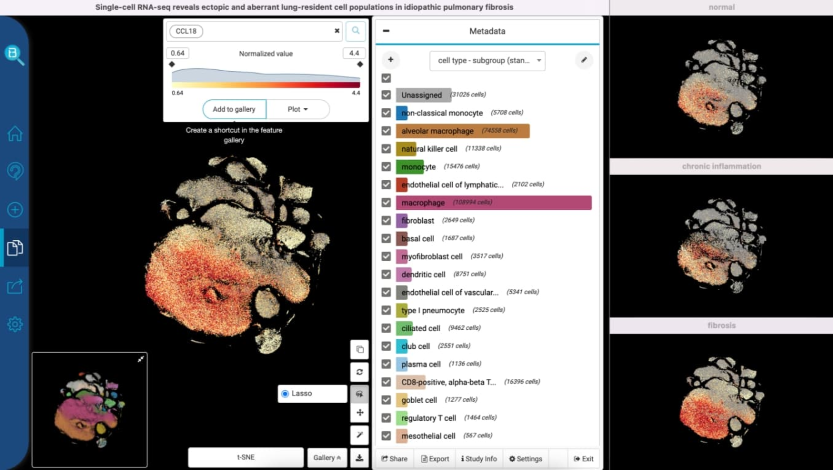
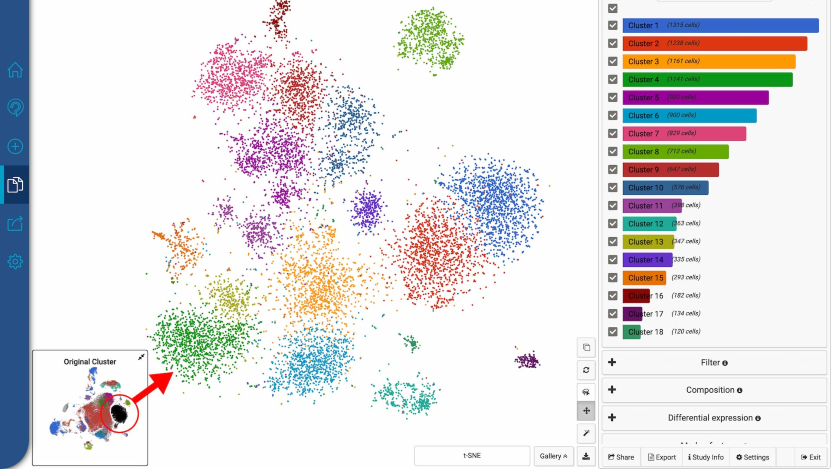
BioTuring’s BBrowser is a software solution that helps scientists effectively analyze single-cell omics data. It combines big data with big computation and modern data visualization to create a unique platform where scientists can interact and obtain important biological insights from the massive amounts of single-cell data. BBrowser has three main components: a curated single-cell database, a big-data analytics layer, and a data visualization module.
My Contributions
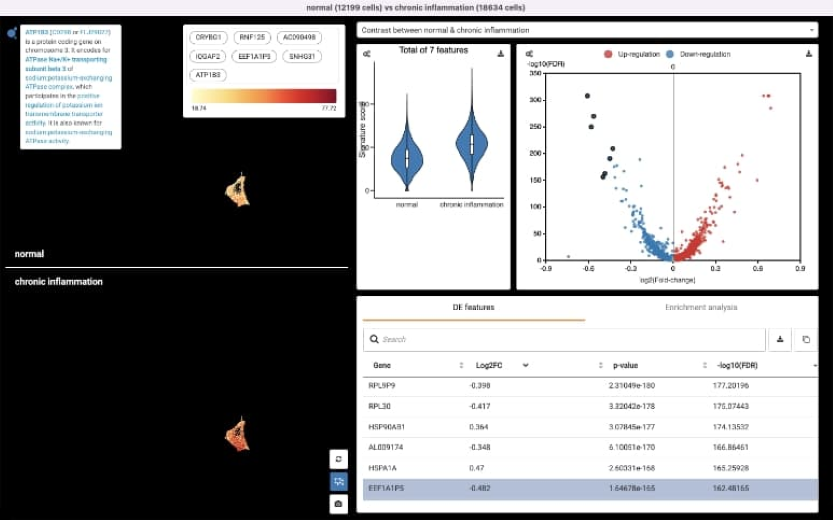
Gene differential expression analysis
-
Implementead a new interface for the gene differential expression (DE) analysis . -
Implemented the statistical tests e.g. t-Test, Wilcoxon, ANOVA running in R backend service. -
Optimized DE process to reduce analysis execution time.
Scientific plotting
- Implemented
new feature expression heatmap that supports visualizing up to millions of cells in a single heatmap . Switched from Seurat heatmap to ComplexHeatMap package in R. -
Built a custom feature heatmap function using ComplexHeatMap package. - Implemented
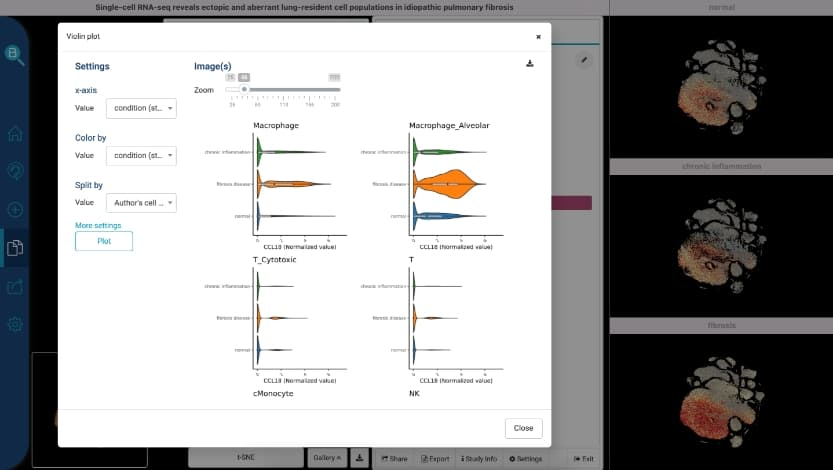
new violin plot feature that support visualizing multi genes and multi annotations. -
Improved scatter plot feature by including annotation feature, gene expression coloring, etc.
Internal data delivery pipeline
-
Implemented the interface for the internal data delivery pipeline . - The interface is
used internally by BioTuring's data science team to release/update data to the public database. - The interface talks to the backend service which
allows users to schedule a data delivery task ;Creating new data entry e.g. Title, abstract, technology, etc &pushes the entry to a MongoDB and the data object to a Amazon S3 .
Database search & overview
-
Implemented a search filter feature for BioTuring database . The feature allows users tofilter the data by BioTuring curated cell types, annotations, technology, and keywords . -
Implemented a feature to summarize the data through visualizing the cell type data using bar plot, sunburst plot. The feature displays the number of cell types and the components of each cell class before requiring the users to download the data.
Cell search feature
-
Implemented a new interface for cell search feature which displays the cell ontology, data's cell composition, etc. -
Implemented a cell ontology visualization feature . This displays a tree-like structure, which tells the relationship of the cell type (parent cell, children cells).
Maintained legacy code
- Maintained legacy JavaScript, R, and Python code written for both frontend and backend.


